Flattening the leaRning curve: Teaching R online during COVID-19
 Photo by Martin Adams on Unsplash
At this point, you’re probably familiar with the phrase “flatten the curve” — remember back in March when we were all talking about that? It was part of a critical public health messaging campaign aimed at slowing the spread of COVID-19 to prevent hospitals from becoming overwhelmed beyond their capacity. Based on how things are going, we really should still be talking about that. So allow me to unabashedly steal this catchphrase as a flawed metaphor for teaching and learning R during the era of this pandemic…
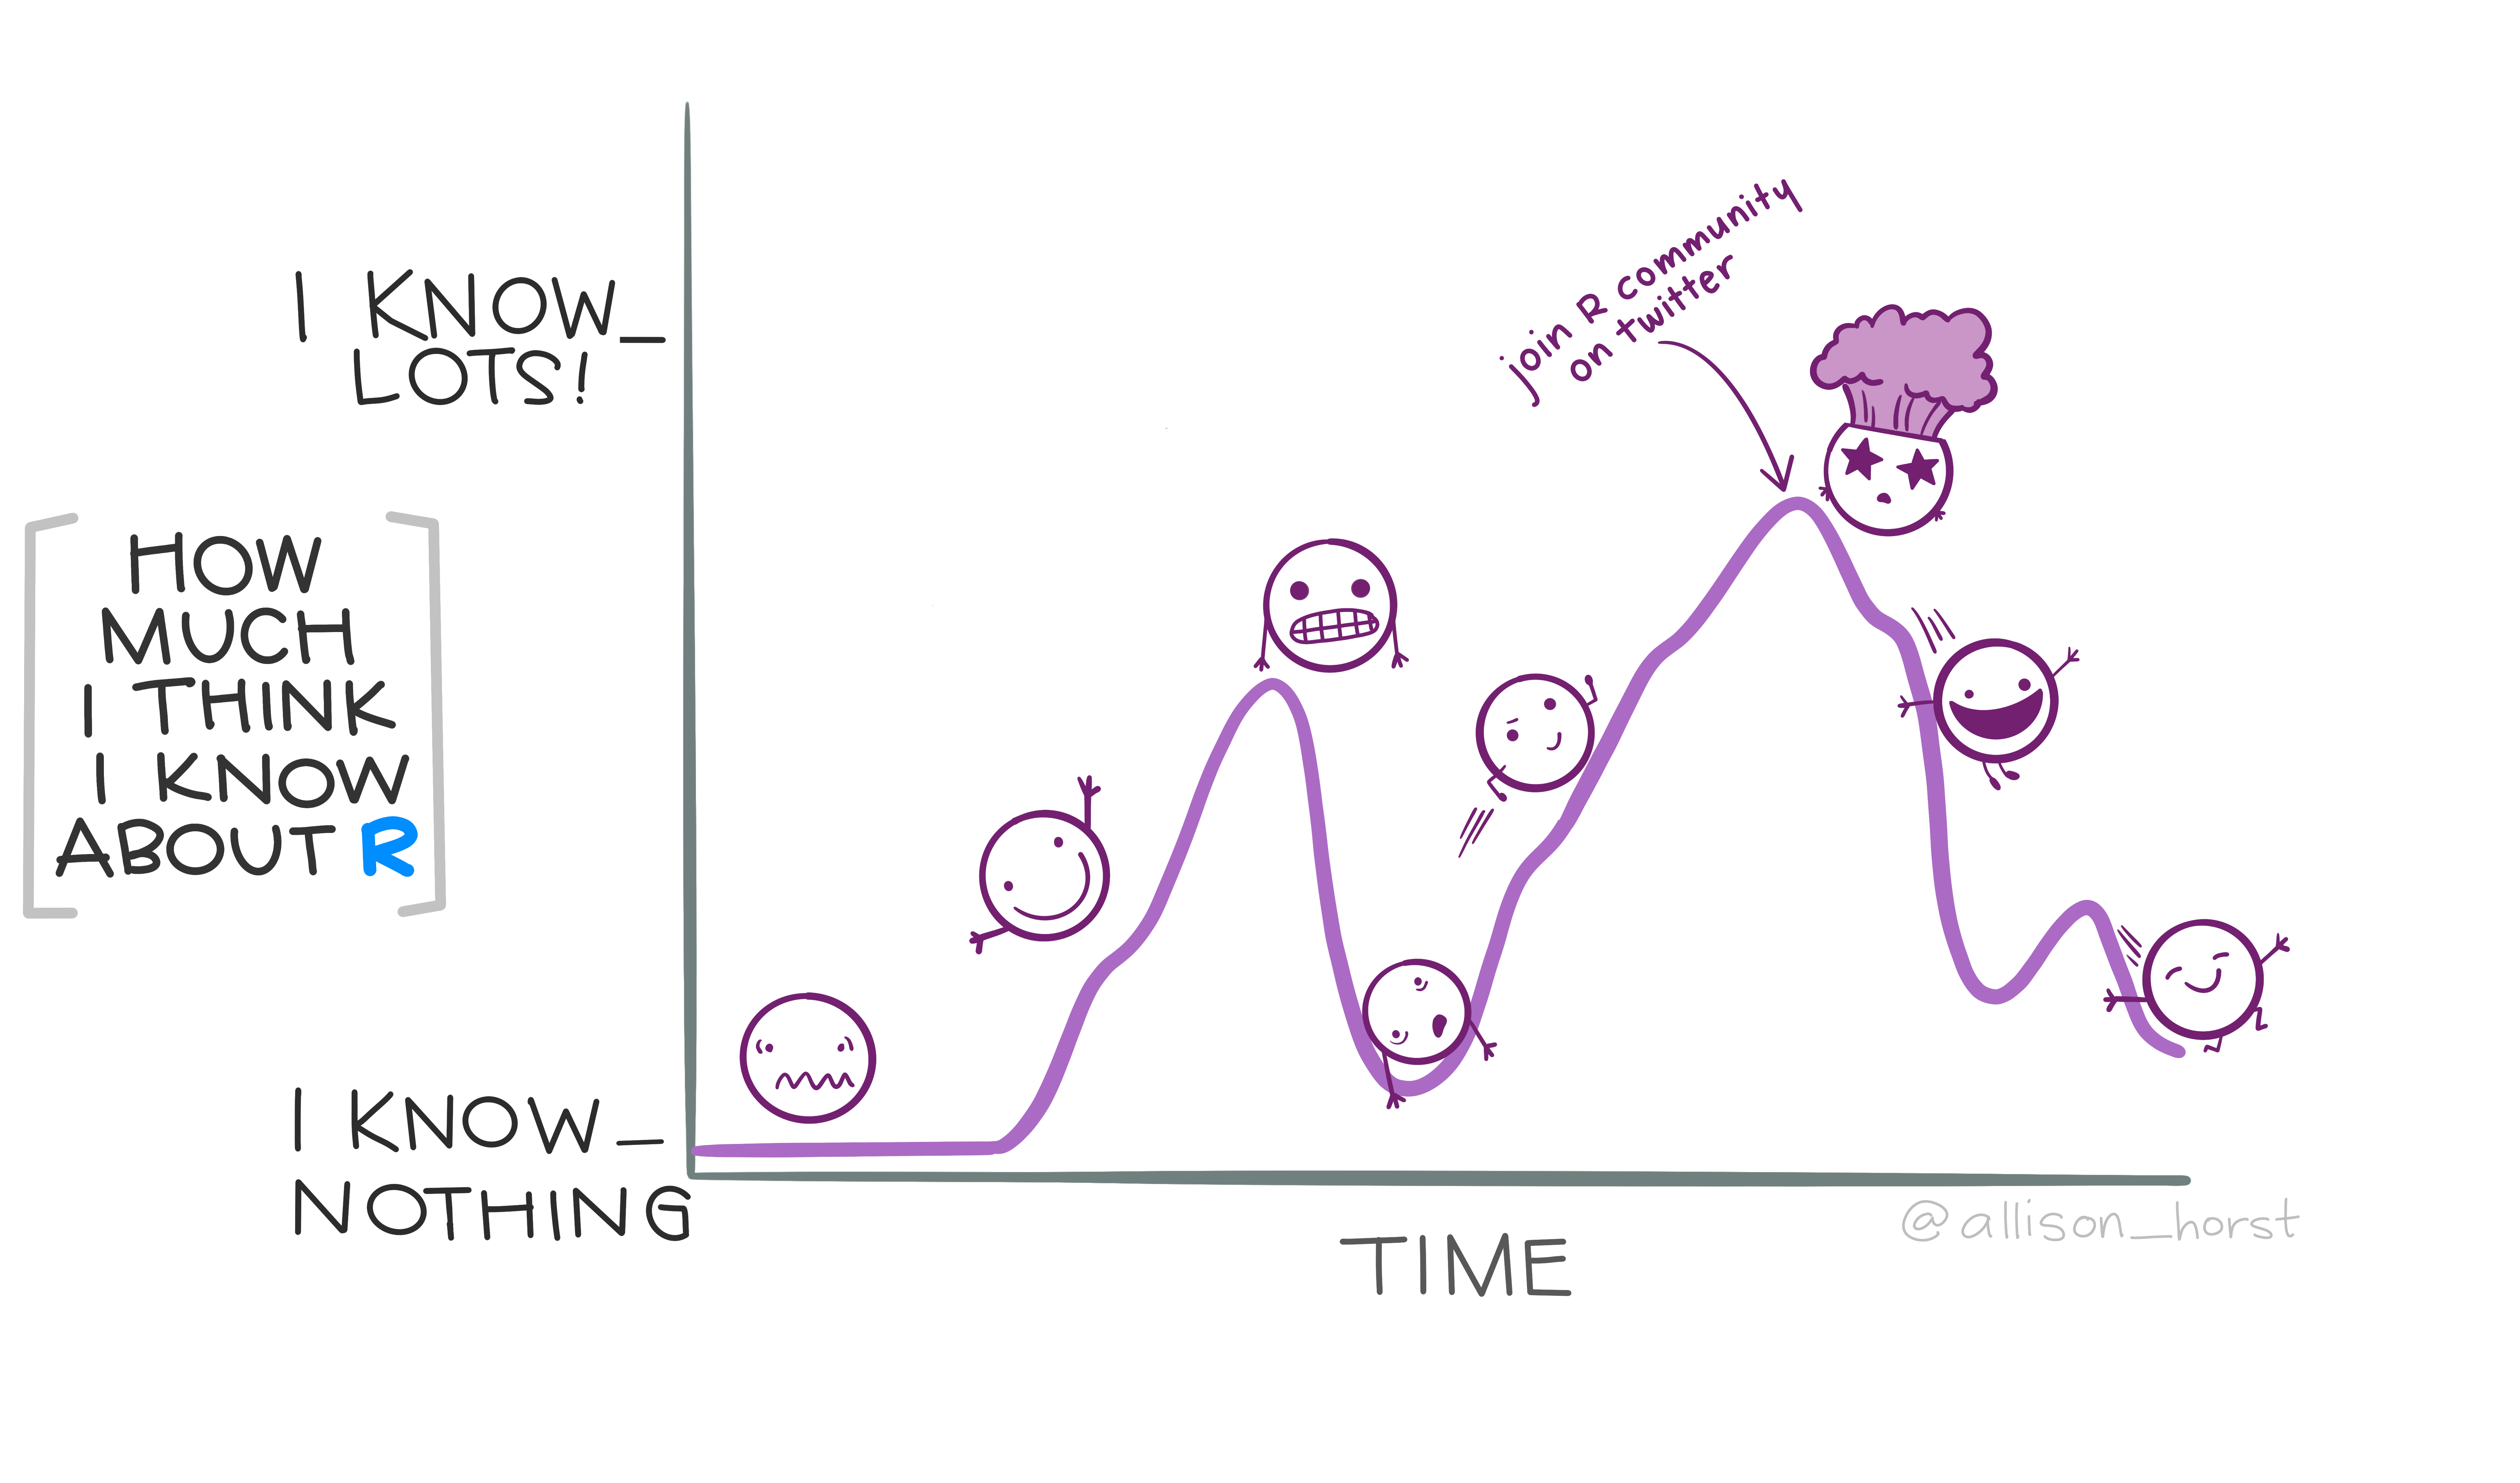
It’s no secret that R has a significant leaRning curve — and, while it seems that more people than ever are now wanting to learn R, almost everyone is having to do it in an online format of some kind. For those who are used to a traditional in-person classroom environment, having a first introduction to R in an online format might make the leaRning curve even steeper (as I said, a flawed metaphor – the concept of a “steep learning curve” is actually the opposite of what most people think, but we’ll run with it anyway). After recently teaching an introductory R Bootcamp online, I’ve spent a lot of time thinking about strategies to lower the learning threshold and make it easier to conquer any potential fear of learning R – to “flatten the leaRning curve”, as it were.
For anyone who might be new to teaching R, teaching online, or both, the goal of this post is to share some valuable lessons I learned and resources I used during this online teaching experience. I hope it may be of some benefit for your own teaching.
Background
Back in Fall 2018, the Department of Psychology at the University of Oregon started to offer a grad-student-led introductory R Bootcamp the week before the start of the new academic year. The bootcamp consists of three 3-4 hour sessions that take place over the course of a week. The idea behind the bootcamp is to give a first exposure to R to incoming students who have little to no background in it before being launched headfirst into using R to analyze data for their first year project and to complete labs and homework assignments for PSY611, the first in a series of graduate statistics courses taught entirely in R.
In addition, as I’ve written about previously, current grad students, along with other members of the psychology department, have expressed a keen interest in developing a stronger foundation in skills such as basic programming, data wrangling, and data visualization. So the bootcamp also serves as an opportunity for existing R users to get a refresher and deeper dive into those topics for those who want it.
After spending lot of time thinking about how to improve the data science learning experience for my fellow grad students and having recently become an RStudio Certified Instructor in the tidyverse, it was my great privilege to be able to put all of this into action by leading the 3rd Annual UO Psych Bootcamp this year. 🥳
The challenge
However, I found myself facing a rather significant challenge. The R Bootcamp, like many intro R workshops, usually occurs in-person in a large room with a giant projector screen, coffee and snacks, and, most importantly, the ability to run over and look over someone’s shoulder at their computer screen when they need help. Because of COVID-19, I needed to design and deliver a bootcamp for a large group of beginners (many using R for the very first time) entirely over a webcam.
Moreover, I assumed that student motivation would be at an all-time low and feelings of anxiety and uncertainty would be at an all-time high – especially for those about to start their graduate school journey entirely online, very much contrary to plan. There were a lot of horrible things going on in the world in September 2020, which marked 6 months into the COVID-19 pandemic in the U.S. – people’s loved ones were getting sick, the killing of innocent Black lives continued, a bitter presidential race reached full swing – not to mention devastating wildfires that raged all along the west coast. (Of course, while I wish I could actually write about these events in the past tense, all of these problems continue).
So, how do you get people excited about learning R amidst all of that? Needless to say, this felt a little daunting 😨. Fortunately, though, there are people out there who are experts in this sort of thing who have graciously shared their resources and advice, and this helped me immensely to run a successful bootcamp.
Who attended?
52 people registered for the bootcamp. While the majority of those who attended were incoming first-year psychology grad students, we also had a mix of more advanced grad students, undergrads, research assistants, lab managers, staff data analysts, and faculty members from a variety of departments/centers across the University, including the Departments of Psychology, Linguistics, Economics and the Center for Translational Neuroscience.
# import bootcamp registration data
registration <- read_csv("uopsych_bootcamp_registration_deidentified.csv")

# clean data
plot_data <- registration %>%
  janitor::clean_names() %>%
  select(position = what_is_your_position_at_uo,
         experience = do_you_have_any_experience_in_r_no_experience_is_required) %>%
  mutate(position = factor(case_when(position %in% c("Undergraduate", "Undergraduate student") ~ "Undergrad Student",
                                     position %in% c("RA", "Lab Manager", "Data Analyst") ~ "Research Staff",
                              TRUE ~ as.character(position))),
         experience = factor(experience, levels = c(
           "I've never heard of it",
           "I've heard of it but have never used it",
           "I've opened it before",
           "I've used it to analyze data",
           "I use it often to analyze data")))

# plot positions at UO
theme_set(theme_minimal(base_size = 15))
theme_update(legend.position = "none",
          plot.title.position = "plot",
          panel.grid.minor.y = element_blank())

plot_data %>%
  count(position) %>%
  ggplot(aes(fct_reorder(position, n), n, fill = position)) +
  geom_col() +
  coord_flip() +
  scale_fill_manual(values = get_pal("Kotare")) +
  labs(x = "", y = "Count", title = "Participants' roles at University of Oregon")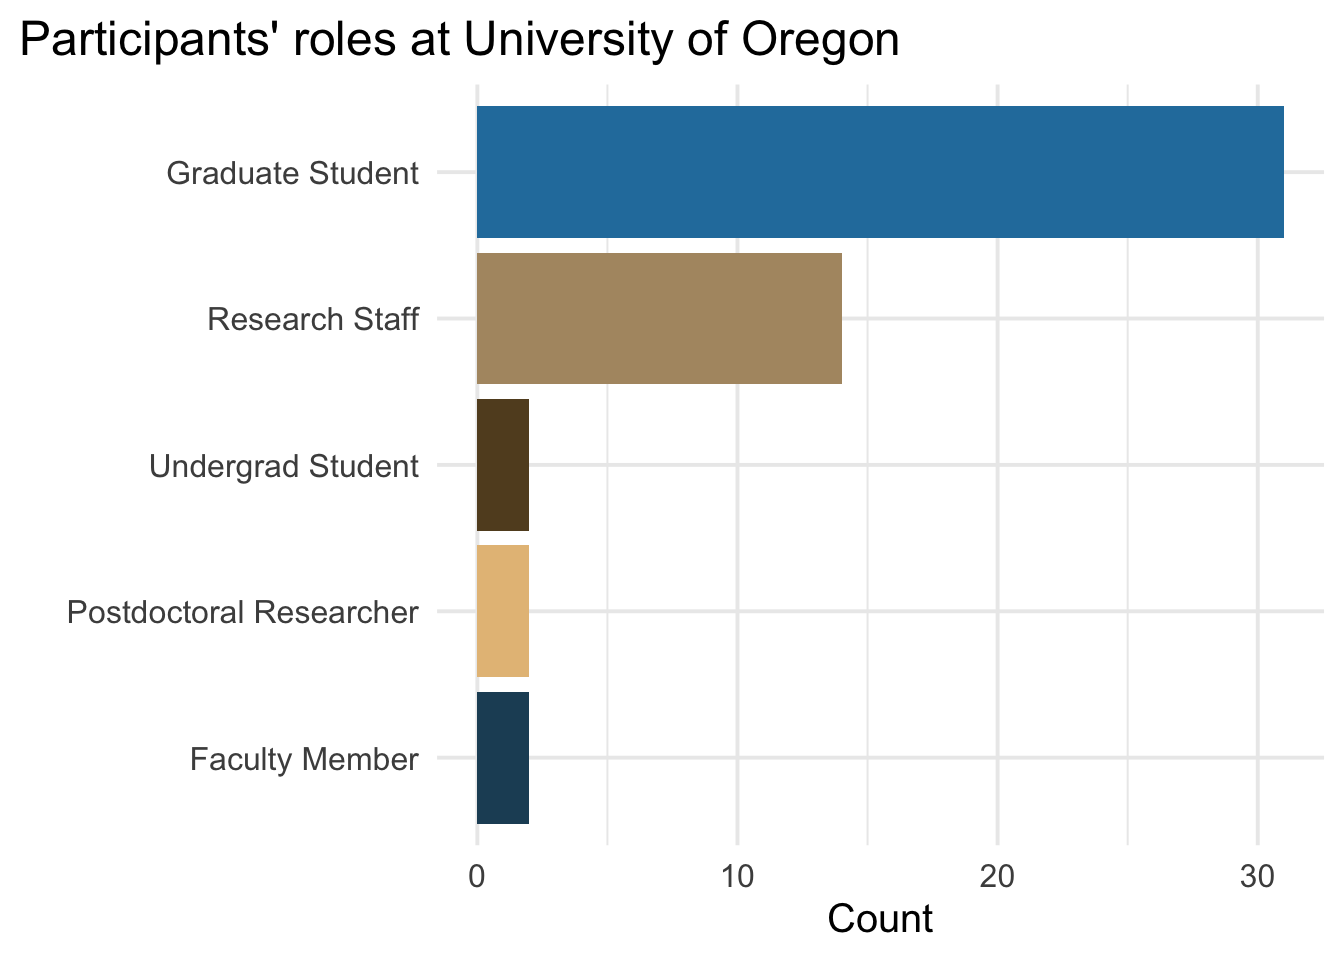
# plot prior experience
plot_data %>%
  count(experience) %>%
  ggplot(aes(experience, n, fill = experience)) +
  geom_col() +
  coord_flip() +
  scale_fill_manual(values = get_pal("Kaka"))  +
  labs(x = "", y = "Count", title = "Participants' prior experience with R")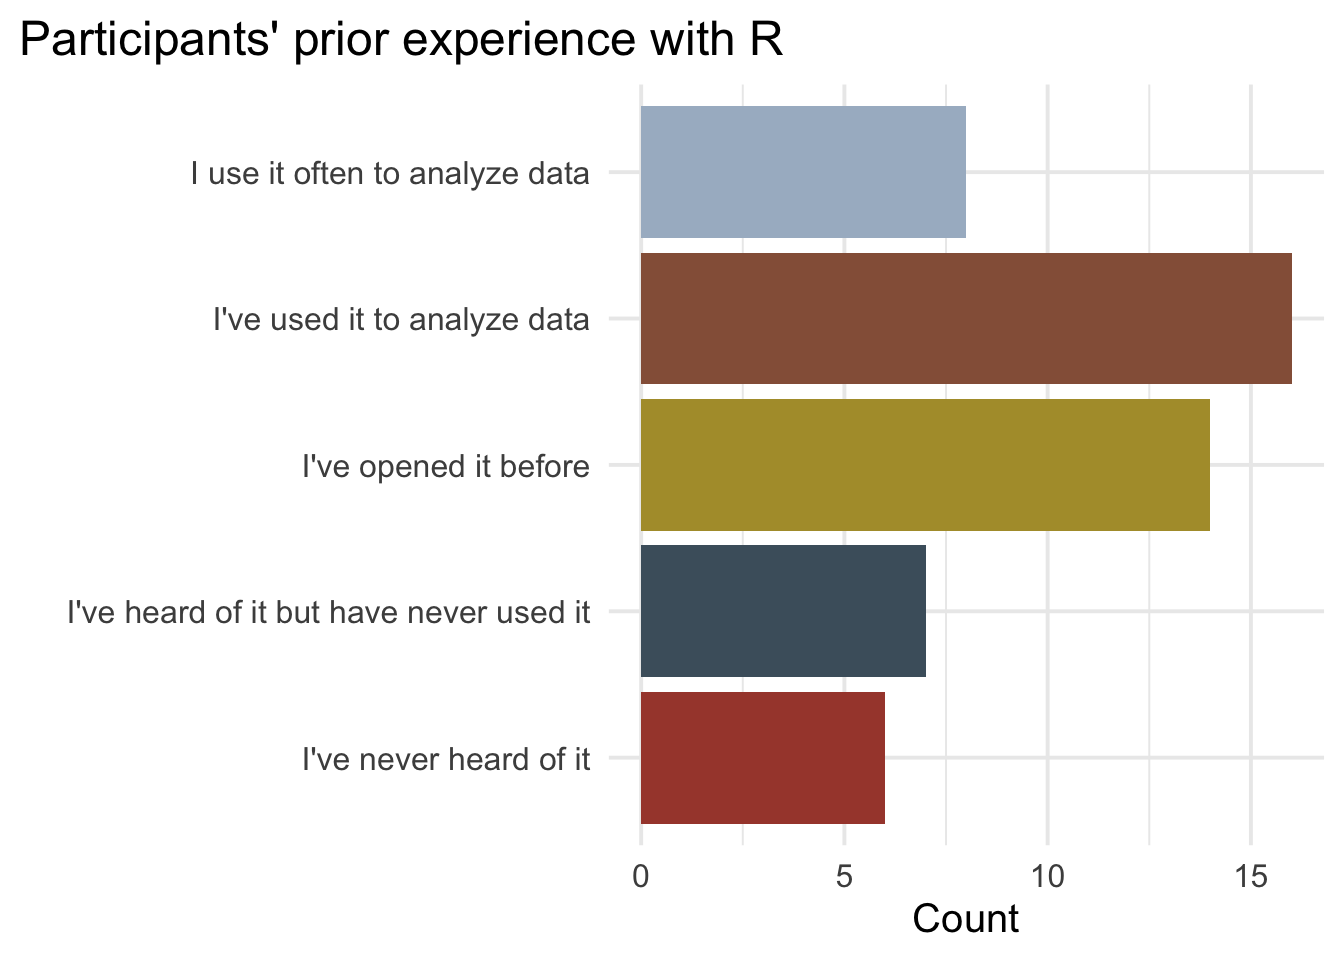
Logistics
Zoom + Slack = 👌
We ran synchronous sessions live over Zoom. However, rather than use the Zoom chat for communicating with each other and asking questions, we used Slack. A few reasons for this:
this way people could continue to ask questions outside of the live sessions and a permanent and searchable record of questions and answers would be available for posterity
The Zoom chat can get easily cluttered and doesn’t easily allow you to make threads, which keep things more organized
Slack has better emojis 🤓.
I was fortunate to have the very knowledgeable and talented Cameron Kay and Cianna Bedford-Petersen as teaching assistants. Cam and Cianna remained on deck throughout the sessions to answer questions on Slack while we went through the material. We also decided that if a student ran into technical issues or felt completely lost, then one of the TA’s would pull them into a breakout room on Zoom to offer one-on-one help.
RStudio Cloud
For “Your Turn” exercises, an idea I stole from Alison Hill’s excellent rstudio::conf(2020) workshop, we used RStudio Cloud, a hosted version of the RStudio IDE available in the web browser. We did this to avoid issues with students installing RStudio on their local machines, as troubleshooting technical issues over Zoom in a large group is not something we felt prepared for. Using RStudio Cloud also allowed me to configure specific IDE settings and pre-load specific packages to allow students to initially avoid technical issues. Lastly, sharing a workspace on RStudio Cloud allowed each student to save their own copy of the projects containing the Your Turn exercises, which in turn made it possible for myself or the TA’s to “peek” into a student’s exercises and help them figure out where their errors were coming from. Overall it went really smoothly, and everyone who filled out the feedback survey said they had no issues using it. I highly recommend using this for your teaching, even if it’s in-person.
Blogdown site
To make the bootcamp materials more accessible and shareable, I decided to package them into a website, which I created using the blogdown package (see more on this below). Organizing your teaching materials into a website has three clear advantages in my mind:
A website makes your materials easier to access and more shareable – you send someone a single link they can access on their phone or computer, no need to download anything
A website is highly sustainable in the sense that it’s easy for students to bookmark and refer back to over and over, and if you push changes to Github with continuous deployment (e.g. via Netlify), students will always have access to the most updated materials. This avoids having to introduce Github and version control, which is a whole other beast to teach to beginners.
Websites are pretty and highly customizble ✨
Tools I learned
xaringanExtra
📦 pkg.garrickadenbuie.com/xaringanExtra
{xaringanExtra} extends the functionality of the already amazing {xaringan} package by Yihuie Xie, and it has become one of my all-time favorite packages. Here are the features I use most often and highly recommend.
📖 Panelset
In case it still isn’t obvious enough how much I love this package…
Ok, {xaringanExtra} continues to blow my freakin' mind 🤯 Here's a quick demo that shows tile view and
— Brendan Cullen (@_bcullen) September 28, 2020embed_xaringan()in the context of a #ggplot2 flipbook (h/t @EvaMaeRey). @grrrck, I owe you an absurd amount of beers 🍻 Thank you for all you do for the #rstats community 🙌 pic.twitter.com/ucMCbOvopW
flair
📦 r-for-educators.github.io/flair
{flair} allows you to spice up your code with color-coding and dynamic syntax highlighting. One of the most useful applications is to match colors to concepts – e.g. giving each argument of a function a unique color. I feel like I’ve only scratched the surface with {flair} and can’t wait to use it more in my teaching going forward.
Below is a demonstration of color-coding with flair to introduce dplyr::filter() and its arguments.
You can read more about other educational use cases for flair in this great post on the RStudio Education Blog.
flipbookr
📦 evamaerey.github.io/flipbooks/about
{flipbookr} is an amazing teaching tool – it allows you to incrementally build up a plot line by line, which capitalizes on the “blink comparator” method. This means that students are able to easily map a specific change in code to a specific visual change in the corresponding plot output. Flipbooks are also great for demonstrating incremental changes in a data wrangling pipeline, and they’re relatively easy to make!
countdown
📦 pkg.garrickadenbuie.com/countdown
{coundown} is another great gem from Garrick and allows you to put timers directly on your slides. This is really useful for timed “Your Turn” exercises or to make sure you stay on track with Q & A sessions or breaks.
Resources I recommend
Sharing on short notice
A super helpful webinar on how best to share your teaching materials online.
Teaching online on short notice
Concrete tips and advice on making the most of teaching via a webcam. There’s a ton of great stuff in here you wouldn’t necessarily think of, including important advice on making your teaching accessible and inclusive in an online format.
Teaching R online with RStudio Cloud
A very thorough and easy to follow walk-through of using RStudio Cloud for teaching, highlighting its most useful features.
Teaching the tidyverse in 2020
A series of blog posts describing a recommended order in which to teach tidyverse topics to beginners, including very recent tidyverse features that are useful for R users at all levels to learn
Data science concept maps
A growing list of concept maps related to data science topics in R. Great for planning your lessons and/or sharing in your slides to summarize topics, no matter how seemingly simple or complex.
Community contributors, curated by Greg Wilson
rstats artwork
A collection of mind-blowing art that makes it 1000% more fun to learn R.
The importance of encouragement & positivity
The leaRning curve is no secret. I hadn’t touched R before starting grad school in 2017, but I had heard whispers here and there that learning R is really difficult. But I think there’s an element of self-fulfilling prophecy here. If you expect it to be impossible, then it will feel impossible. I more or less started my journey with that expectation.
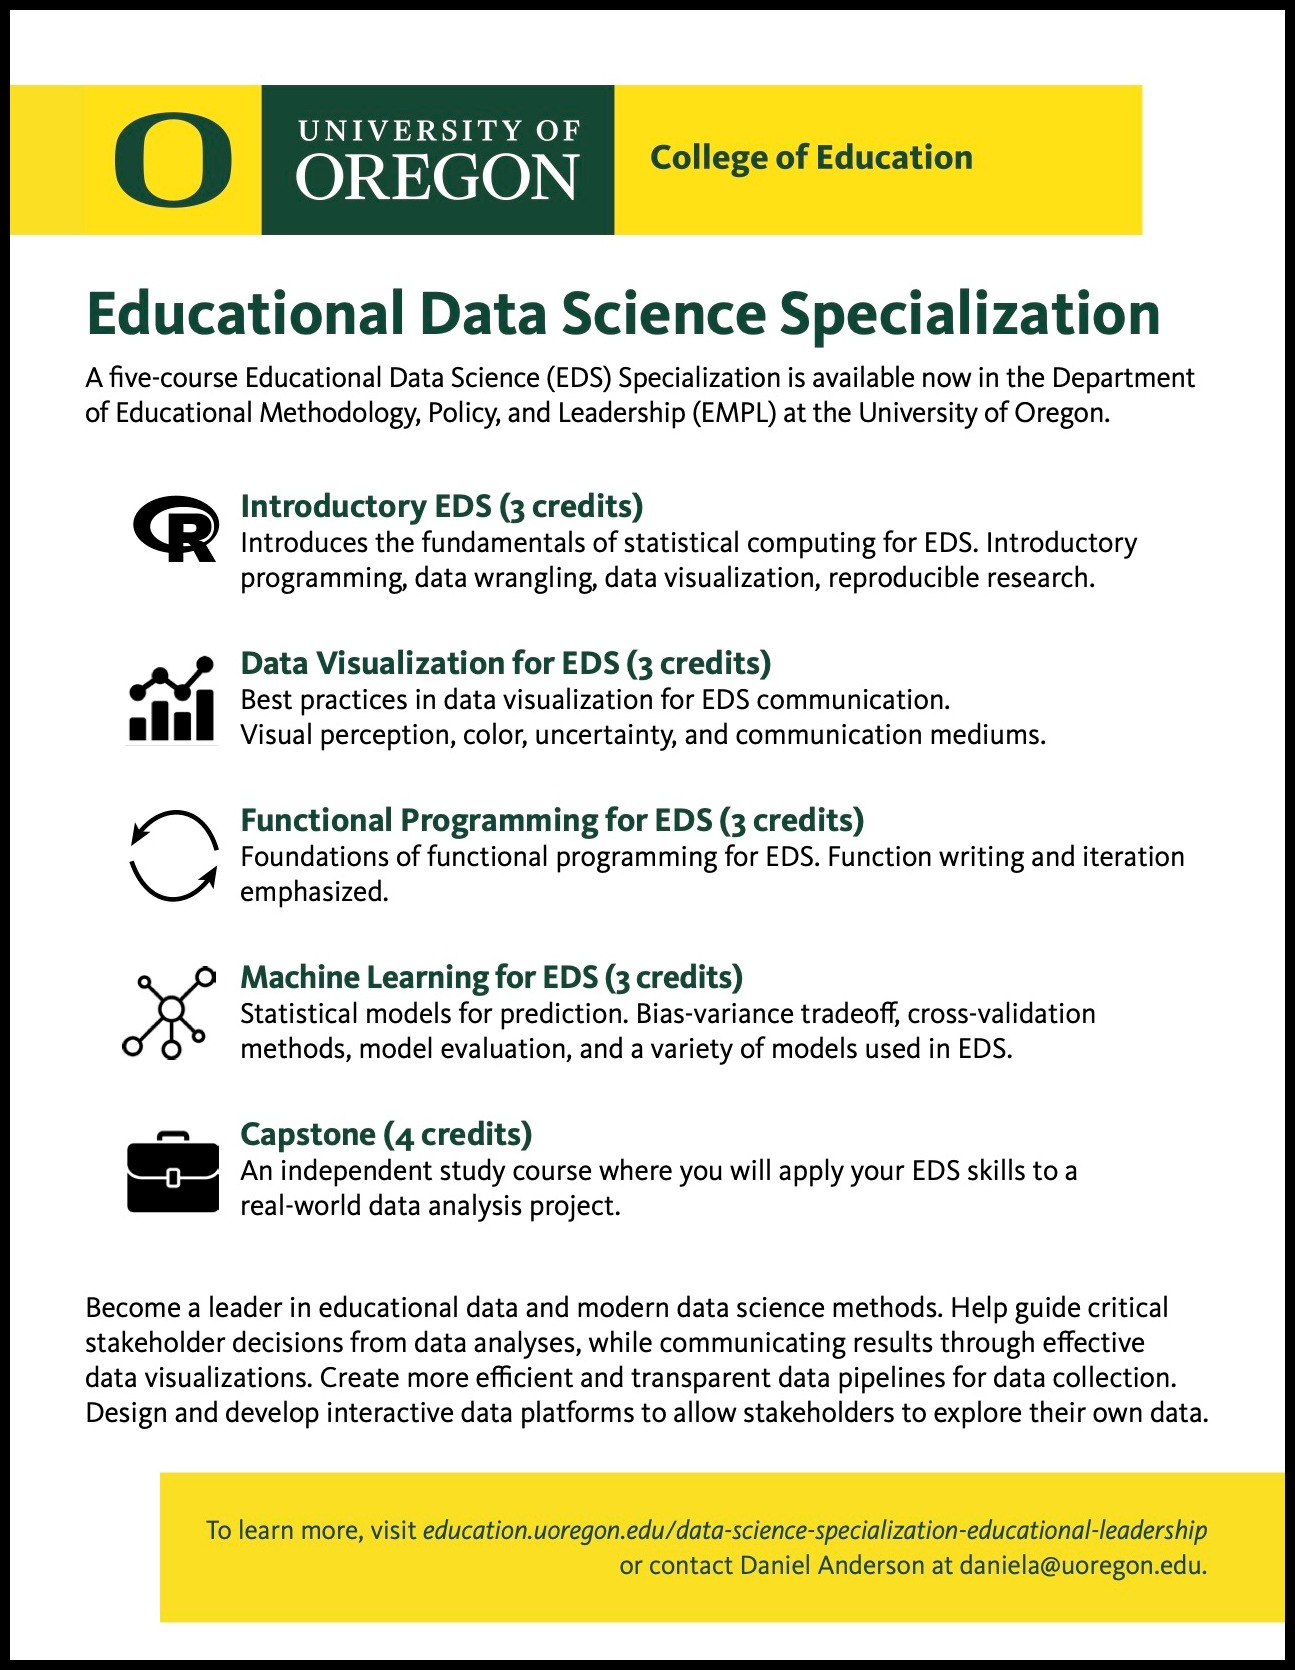
Things changed for me when I took my first course with Daniel Anderson. Daniel has developed a fantastic 5-course Data Science Specialization in Educational Leadership in the College of Education at the University of Oregon, taught entirely in R, which ranges from the very basics of R to advanced machine learning with tidymodels (see more info here). Daniel’s teaching completely changed the way I approached using and learning R, and it was largely on his recommendation that I joined #rstats Twitter (which was a game-changer). More importantly, Daniel modeled the kind of teacher I wanted to be – clear, thorough, thoughtful, and above all else, kind and inclusive of everyone.
It was very much with Daniel’s model in mind that I found inspiration for making learning R feel more inviting and less daunting. Here are a few things that came to mind that can be abstracted to some general advice…
Anticipate the challenge
Recognize the fact that learning R is hard. Don’t pretend it’s a walk in the park – it isn’t. But at the same time, emphasize that the investment of time it takes is worth it! And be sure to remind people of that more than once 😉.
Normalize errors & mistakes
The first time someone uses R, error messages are one of the first things that they’ll see. As we all know, this feels frustrating, especially as a beginner. So it makes sense to acknowledge that up front and discuss what error messages are and why they occur. As error messages go hand-in-hand with debugging, it’s also a good idea to at least introduce that concept as well, without necessarily going into great depth since that’s a whole other topic of it’s own. As debugging is commonly considered part of “what they forgot to teach you about R”, I’m sure I’m not alone in wishing that I had been introduced to debugging much earlier on in my R learning experience.
While learning a systematic approach to debugging is important down the line, it’s more important at first for beginners to understand that seeing lots of error messages at first is not a bad thing. It’s worth spending some effort to convince your students that error messages should not be cause for discouragement or giving up. Simply put, error messages are part and parcel of programming. Sometimes they take a matter of seconds to fix, sometimes a matter of weeks, but everyone who uses R will regularly encounter error messages, no matter your level of experience. And when it really comes down to it, every error message is an opportunity to learn something!
Taking this one step further, it’s a good idea to deliberately incorporate making mistakes into your own teaching and use error messages as a teachable moment. You can even use unintentional mistakes as teachable moments – demonstrate for your students how you fix the mistake and invite them to give their thoughts and feedback. This not only makes your presentation less rehearsed, but it provides a really valuable “real-world” context for learning.
This idea is referred to as “positive error framing” – and if you want to learn more about this topic in depth I recommend you check out this section from the recent article “Ten quick tips for teaching with participatory live coding” (really you should read the whole article – it’s packed full of great advice).
Make your materials friendly and inviting!
If your slides read like one long piece of dense help documentation, people are not going to feel inclined to engage with it. How do you make your materials more inviting and approachable?
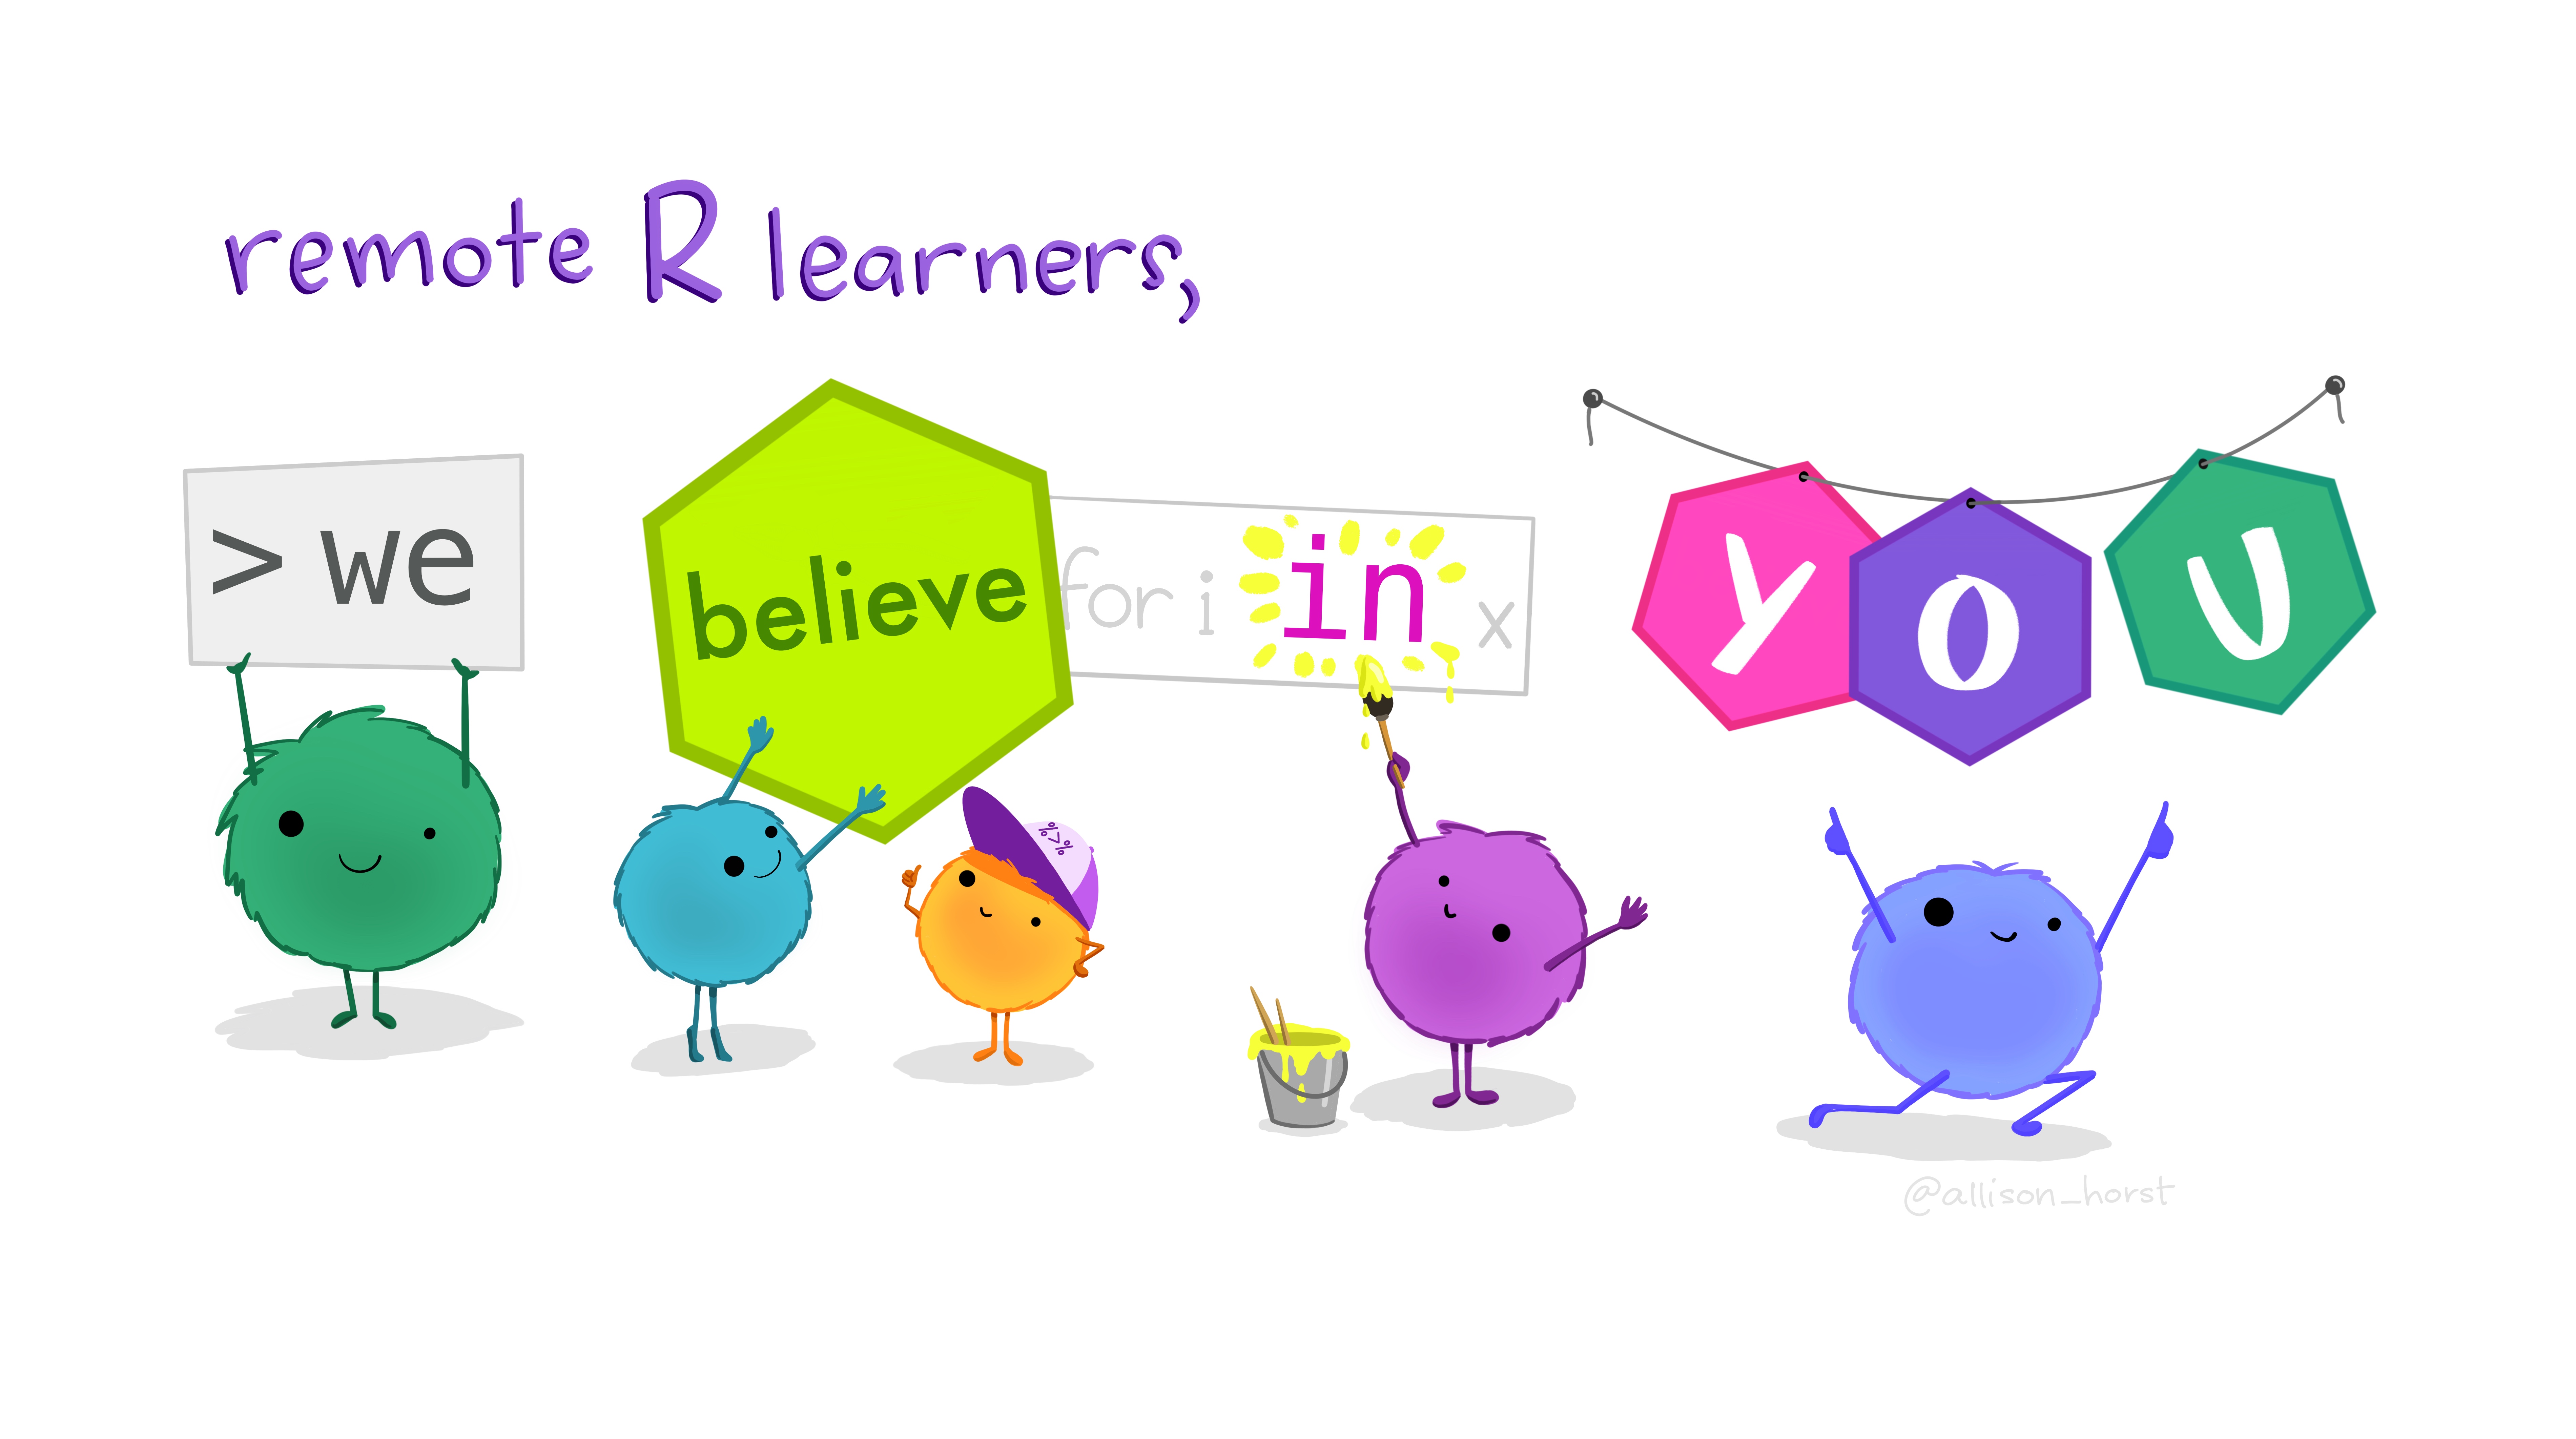
One of the most powerful tools out there, in my opinion, is the incredible artwork by Allison Horst, RStudio’s first artist-in-residence (see more above). The bigger picture behind the artwork, in Allison’s words:
“All of it is towards a goal of trying to make R, and data science in general, more approachable, welcoming, and engaging to diverse learners”.
Cute gifs never hurt either…
If you're teaching #rstats with #palmerpenguins at the moment (which you should be because it's a brilliant dataset 🐧), consider sneaking in a lil' motivational penguin, both for yourself and your students. everything is terrible and we all need small joys now more than ever pic.twitter.com/OHeJWIsqFp
— Brendan Cullen (@_bcullen) September 24, 2020
Feedback
I was really happy to see that people seemed to appreciate the positive learning atmosphere and, especially because this was only an introductory workshop, that this made them excited to learn more:
✍️ “I really appreciated the warm welcome/atmosphere the instructors set up- learning a new programming language can be frustrating, especially for a beginner, so I was really appreciative of the continuous encouragement throughout the bootcamp.”
✍️ “I really enjoyed how supportive and encouraging the facilitators were. I understood learning R was no easy endeavor but hearing about their experiences was encouraging for me. Also, I greatly appreciate all the amazing resources they have compiled for future use. I definitely plan to continue looking into it!”
✍️ “I appreciated the facilitators’ organization, support, encouragement, and instructional clarity. Thank you for providing this very warm and accessible introduction for an absolute first-time novice! It’s encouraged me to take more steps into learning R.”
✍️ “I am now in my third year of struggling through R and this was the first presentation of material that really clicked for me. I frequently refer to the dplyr and ggplot presentations in my work and will continue to work my way through these exercises until I am truly fluent in these basics. THANK YOU”
So we did we flatten the leaRning curve? Only time will tell. But the most gratifying feedback, in my opinion, is that people who attended felt inspired to keep learning and continue riding the R roller coaster. That’s really the best outcome I could have hoped for!
A final thought
In short, no matter how long someone has been using R, it never hurts to remind them (yourself included) that a little time and effort can go a long way.
Acknowledgements
I owe a huge debt of gratitude to all the people who were instrumental in my initial experience of learning R: Daniel Anderson, Dani Cosme, Krista DeStasio, Cory Costello, Jessica Kosie, and Sara Weston, to name only a few.
Thanks again to Cameron Kay and Cianna Bedford-Petersen for being such awesome TA’s for the R Bootcamp.
I also wouldn’t know half of what I know about learning and teaching R if it weren’t for the RStudio Education team – in particular, Alison Hill, Greg Wilson, Desirée De Leon, Mine Çetinkaya-Rundel, and Garrett Grolemund.
Artwork included in this post is by Allison Horst.
Session Info
## ─ Session info ───────────────────────────────────────────────────────────────
##  setting  value
##  version  R version 3.6.2 (2019-12-12)
##  os       macOS Catalina 10.15.6
##  system   x86_64, darwin15.6.0
##  ui       X11
##  language (EN)
##  collate  en_US.UTF-8
##  ctype    en_US.UTF-8
##  tz       America/Los_Angeles
##  date     2020-11-01
##
## ─ Packages ───────────────────────────────────────────────────────────────────
##  package       * version    date       lib
##  assertthat      0.2.1      2019-03-21 [1]
##  backports       1.1.10     2020-09-15 [1]
##  blogdown        0.17       2019-11-13 [1]
##  bookdown        0.21       2020-10-13 [1]
##  broom           0.5.5      2020-02-29 [1]
##  cellranger      1.1.0      2016-07-27 [1]
##  cli             2.1.0      2020-10-12 [1]
##  colorspace      1.4-1      2019-03-18 [1]
##  crayon          1.3.4      2017-09-16 [1]
##  DBI             1.1.0      2019-12-15 [1]
##  dbplyr          1.4.2      2019-06-17 [1]
##  digest          0.6.27     2020-10-24 [1]
##  dplyr         * 1.0.2      2020-08-18 [1]
##  ellipsis        0.3.1      2020-05-15 [1]
##  emo             0.0.0.9000 2020-08-26 [1]
##  evaluate        0.14       2019-05-28 [1]
##  fansi           0.4.1      2020-01-08 [1]
##  farver          2.0.3      2020-01-16 [1]
##  forcats       * 0.4.0      2019-02-17 [1]
##  fs              1.3.1      2019-05-06 [1]
##  generics        0.0.2      2018-11-29 [1]
##  ggplot2       * 3.3.2      2020-06-19 [1]
##  glue            1.4.2      2020-08-27 [1]
##  gtable          0.3.0      2019-03-25 [1]
##  haven           2.2.0      2019-11-08 [1]
##  highr           0.8        2019-03-20 [1]
##  hms             0.5.3      2020-01-08 [1]
##  htmltools       0.5.0      2020-06-16 [1]
##  httr            1.4.2      2020-07-20 [1]
##  janitor         1.2.1      2020-01-22 [1]
##  jpeg            0.1-8.1    2019-10-24 [1]
##  jsonlite        1.7.1      2020-09-07 [1]
##  knitr           1.30       2020-09-22 [1]
##  labeling        0.4.2      2020-10-20 [1]
##  lattice         0.20-38    2018-11-04 [2]
##  lifecycle       0.2.0      2020-03-06 [1]
##  lubridate       1.7.9      2020-06-08 [1]
##  magrittr        1.5        2014-11-22 [1]
##  Manu          * 0.0.1      2020-10-20 [1]
##  modelr          0.1.6      2020-02-22 [1]
##  munsell         0.5.0      2018-06-12 [1]
##  nlme            3.1-142    2019-11-07 [2]
##  pillar          1.4.6      2020-07-10 [1]
##  pkgconfig       2.0.3      2019-09-22 [1]
##  png             0.1-7      2013-12-03 [1]
##  purrr         * 0.3.4      2020-04-17 [1]
##  R6              2.4.1      2019-11-12 [1]
##  Rcpp            1.0.5      2020-07-06 [1]
##  readr         * 1.3.1      2018-12-21 [1]
##  readxl          1.3.1      2019-03-13 [1]
##  reprex          0.3.0      2019-05-16 [1]
##  rlang           0.4.8      2020-10-08 [1]
##  rmarkdown       2.5        2020-10-21 [1]
##  rstudioapi      0.11       2020-02-07 [1]
##  rvest           0.3.5      2019-11-08 [1]
##  scales          1.1.1      2020-05-11 [1]
##  sessioninfo     1.1.1      2018-11-05 [1]
##  snakecase       0.11.0     2019-05-25 [1]
##  stringi         1.5.3      2020-09-09 [1]
##  stringr       * 1.4.0      2019-02-10 [1]
##  tibble        * 3.0.4      2020-10-12 [1]
##  tidyr         * 1.1.0      2020-05-20 [1]
##  tidyselect      1.1.0      2020-05-11 [1]
##  tidyverse     * 1.3.0      2019-11-21 [1]
##  vctrs           0.3.4      2020-08-29 [1]
##  withr           2.3.0      2020-09-22 [1]
##  xaringanExtra * 0.2.1      2020-08-23 [1]
##  xfun            0.18       2020-09-29 [1]
##  xml2            1.2.2      2019-08-09 [1]
##  yaml            2.2.1      2020-02-01 [1]
##  source
##  CRAN (R 3.6.0)
##  CRAN (R 3.6.2)
##  CRAN (R 3.6.0)
##  CRAN (R 3.6.2)
##  CRAN (R 3.6.2)
##  CRAN (R 3.6.0)
##  CRAN (R 3.6.2)
##  CRAN (R 3.6.0)
##  CRAN (R 3.6.0)
##  CRAN (R 3.6.0)
##  CRAN (R 3.6.0)
##  CRAN (R 3.6.2)
##  CRAN (R 3.6.2)
##  CRAN (R 3.6.2)
##  Github (hadley/emo@3f03b11)
##  CRAN (R 3.6.0)
##  CRAN (R 3.6.0)
##  CRAN (R 3.6.0)
##  CRAN (R 3.6.0)
##  CRAN (R 3.6.0)
##  CRAN (R 3.6.0)
##  CRAN (R 3.6.2)
##  CRAN (R 3.6.2)
##  CRAN (R 3.6.0)
##  CRAN (R 3.6.0)
##  CRAN (R 3.6.0)
##  CRAN (R 3.6.0)
##  CRAN (R 3.6.2)
##  CRAN (R 3.6.2)
##  CRAN (R 3.6.0)
##  CRAN (R 3.6.0)
##  CRAN (R 3.6.2)
##  CRAN (R 3.6.2)
##  CRAN (R 3.6.2)
##  CRAN (R 3.6.2)
##  CRAN (R 3.6.0)
##  CRAN (R 3.6.2)
##  CRAN (R 3.6.0)
##  Github (G-Thomson/Manu@c5aa932)
##  CRAN (R 3.6.0)
##  CRAN (R 3.6.0)
##  CRAN (R 3.6.2)
##  CRAN (R 3.6.2)
##  CRAN (R 3.6.0)
##  CRAN (R 3.6.0)
##  CRAN (R 3.6.2)
##  CRAN (R 3.6.0)
##  CRAN (R 3.6.2)
##  CRAN (R 3.6.0)
##  CRAN (R 3.6.0)
##  CRAN (R 3.6.0)
##  CRAN (R 3.6.2)
##  CRAN (R 3.6.2)
##  CRAN (R 3.6.0)
##  CRAN (R 3.6.0)
##  CRAN (R 3.6.2)
##  CRAN (R 3.6.0)
##  CRAN (R 3.6.0)
##  CRAN (R 3.6.2)
##  CRAN (R 3.6.0)
##  CRAN (R 3.6.2)
##  CRAN (R 3.6.2)
##  CRAN (R 3.6.2)
##  CRAN (R 3.6.0)
##  CRAN (R 3.6.2)
##  CRAN (R 3.6.2)
##  Github (gadenbuie/xaringanExtra@f85b70a)
##  CRAN (R 3.6.2)
##  CRAN (R 3.6.0)
##  CRAN (R 3.6.0)
##
## [1] /Users/bcullen/Library/R/3.6/library
## [2] /Library/Frameworks/R.framework/Versions/3.6/Resources/libraryBrendan Cullen
Doctoral Student | NSF GRFP Fellow
Psychology PhD student and aspiring data scientist studying precision medicine approaches to health behavior change.